

1. 🧭 Ethereum Technical Analysis 2025: Introduction
First of all, you must understand the basics of Ethereum technical analysis 2025: Ethereum (ETH) has pierced the $3,675 level in 2025 as strong institutional ETF inflows collide with ongoing protocol upgrades and elevated on‑chain demand.
- Macro catalysts & network fundamentals
- Support, resistance, & chart formation insights
- Momentum indicators (MACD, RSI, Bollinger)
- Historic cycle analysis
- Advanced options and derivatives strategies
- On-chain metrics & sentiment
- Strategic trade guidance with risk control
- Price scenarios and Conclusion
2. 🚀 Macro Catalysts & Protocol Enhancements
2.1 Spot ETF Inflows & Institutional Adoption

- Spot ETH ETFs recorded a record $726M inflow on July 16, lifting cumulative July inflows beyond $2B.
- Additionally institutional adoption mirrored by treasury buys: major portfolios now include hundreds of thousands of ETH .
First of all, what do you think will ethereum surpass bitcoin in the bull run 2025? Also, a lot of experts predict a ethereum price prediction $100,000 will be one they real this price or is just a speculation?
However, let’s make a dip dive into ether.
2.2 Regulatory Momentum & Stablecoin Legislation
- Moreover, U.S. stablecoin regulation passed in mid-July – beneficial for Ethereum, home to most stablecoin issuance .
2.3 Protocol Upgrades – Pectra & Dencun
Also, other upgrades include:
- Pectra (May 2025): EIP‑7702 enables wallet abstraction; EIP‑7251 removes validator staking cap.
- Dencun reduced L2 costs ≈80%, improving scalability.
🚀 What Is the Pectra Upgrade?
In addition the Pectra upgrade, activated on May 7, 2025, is Ethereum’s latest—and perhaps most extensive—protocol upgrade since the Merge. It combines two major changes: Prague (execution layer improvements) and Electra (consensus layer enhancements), introducing a suite of 11 Ethereum Improvement Proposals (EIPs) that enhance scalability, staking, wallet usability, and network efficiency.
🔍 Why It Matters
- Scalability Boost – Also, Pectra doubles blob capacity per block, cutting layer-2 transaction costs and improving throughput.
- Validator Upgrades – It raises the validator stake cap from 32 ETH to 2,048 ETH, also making staking more efficient and flexible.
- Account Abstraction – Thanks to EIP‑7702, regular wallets (EOAs) can run smart-contract logic temporarily, enabling features like gas sponsorship and batch transactions.
- Security & Efficiency – Upgrades like BLS precompiles and improved historical data handling enhance network security and validation speed
In fact, Pectra builds on previous upgrades like Shanghai/Capella (staking withdrawal support) and Dencun (blob-based proto-sharding), also setting the stage for future milestones like Verkle trees and stateless clients.

🧭 In Summary
The Pectra upgrade is Ethereum’s most ambitious update yet, weaving together enhancements across technical layers—boosting wallet UX, staking flexibility, network security, and L2 cost-efficiency. It’s a significant leap forward, making Ethereum feel faster, smarter, and more scalable for every stakeholder.
3. 📈 Ethereum Technical Analysis 2025: Price Structure & Technical Patterns
3.1 Key Price Zones
- Support: $3,400–$3,500—validated by ETF retests, whale accumulation.
- Resistance: $3,675–$3,700 (July high); next range $4,000–$4,200; extended $4,500–$4,900 cluster from historical data.
3.2 Chart Patterns
- Also, Cup‑and‑Handle (Weekly): Skin to break toward $4,100–$4,200.
- Bull Flag: Projects to $4,500–$4,900 per flag target & MVRV guidance.
4. 📊 Ethereum Technical Analysis 2025: Momentum Tools & Volatility Indicators
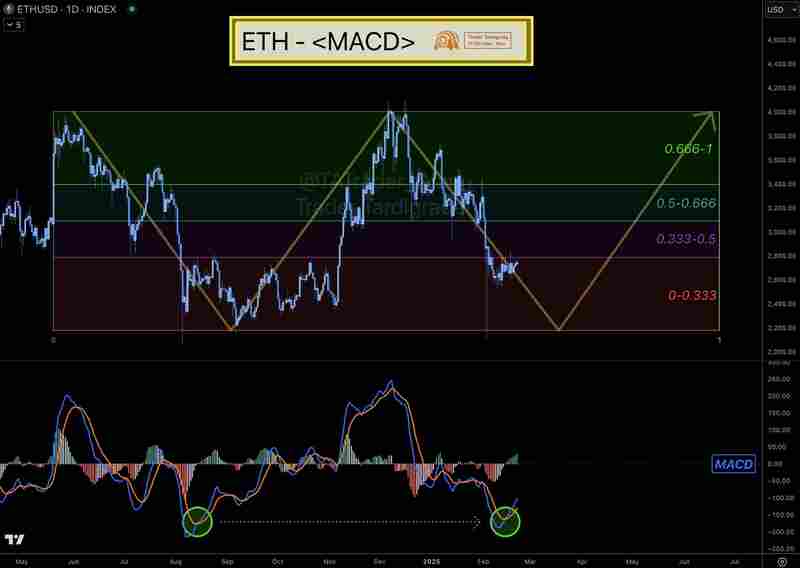
4.1 MACD & RSI
- MACD: Weekly histogram above zero—preceded past bursts.
- RSI: Climbing past 70; watch for overbought signals, while bull structure remains intact.
4.2 Bollinger Bands & ATR
- ETH hugging upper Bollinger Band—suggests possible consolidation.
- ATR ~140–160 highlights rising volatility.
5. 📉 Ethereum Technical Analysis 2025: On‑Chain Metrics & Historic Cycle Context
5.1 MVRV, NUPL, Exchange Reserves
- MVRV bands point to cycle top near ~$4,900.
- NUPL in positive territory; SOPR improvement supports break-evading sell pressure .
- Exchange reserves at lows—the classic bullish marker seen in prior cycles.
5.2 Historical Cycle Patterns
- However, Ethereum shows typical ~825-day bull cycle following bottom (circa Sept 2019); new low ~21 days ago implies entry to cycle.
- In fact, fractal analysis suggests repeat structure akin to Bitcoin’s past rally after ~342% recovery from dips.
6. 🧠 Advanced Derivatives: Ethereum Options & ETF Strategies
6.1 Institutional Options Vehicles
- First of all, ETH spot ETFs (e.g., BlackRock’s ETHA) now support liquid options trading, offering capital-efficient and hedged exposure.
- Also, allows synthetic long positions or downside protection strategies for institutional players.
6.2 Retail & Professional Options Usage
- Basic strategies: Calls for leverage, puts for downside—common among ETH enthusiasts.
- Advanced hedging:
- Long Condor: Non-directional strategy with limited loss, profitable in narrow bands.
- Synthetic Long or Collar: Combine calls/puts to replicate long position while capping downside .
6.3 Ethereum Technical Analysis 2025: Institutional Flow: ETF Options
- In fact, SEC approval for options trading on spot ETFs opens layered hedging/liquidity tools for institutions.
7. 🧭 Ethereum Technical Analysis 2025: Trading Strategy & Risk Management
7.1 Setup, Targets & Exits
- Entry: On volume-backed retest between $3,400–$3,600.
- Profit Targets:
- $4,000 (psycho-level),
- $4,100–$4,200 (pattern breakout),
- $4,500–$4,900+ (MVRV/bull flag)
- Stops: Sub-$3,400 tight, or conservative sub-$3,200.
7.2 Risk Behavior
- In addition, use multi-timeframe signals: Align MACD/RSI/EMA across daily and 4-hour charts.
- Scale-in entries & exits to reduce risk—half position at breakout, remainder as confirmation.
- Risk cap: 1–3% of portfolio; trail stops when price breaks higher.
8. 🔭 Ethereum Technical Analysis 2025: Market Scenarios & Time-Based Outlook
| Scenario | Trigger | Price Projection |
|---|---|---|
| 🟢 Bullish | Cup breakout, ETF & options flows sustain | $4–$4.9k (mid-2025), $8k+ by end-2025 |
| 🟡 Consolidation | RSI & volatility cool, Bollinger squeeze | $3.6–$3.9k |
| 🔴 Pullback | Resistance hold, market-wide weakness | $3.2–$3.4k |
Year-end outlook: Institutional and options flow (~$4,900 MVRV top) suggest possibility of $8k+ scenario, per analysts.
9. 🧾 Ethereum Technical Analysis 2025: Conclusion & Trading Summary
- ETF inflows (≈$726M/day) and historically low exchange reserves provide a bullish base .
- Pectra/Dencun upgrades enhance network efficiency and appeal.
- MACD & RSI bullish across breaking timeframes; Bollinger Band squeeze hints next move.
- On-chain MVRV, NUPL position cycle top near $4,900.
- Historic cycle + options setups support path to $4–8k by 2025.
- Key entry, targets, and risk guidelines provided with tactical detail.
👥 Final Thoughts For users and investors:
- See how this impacts your wallet—learn how Ethereum with Pectra makes transactions faster and cheaper
- In fact, Protect your assets—check our guide on secure staking and withdrawal practices
- Never miss future upgrades: Subscribe to our newsletter now — be the first to know